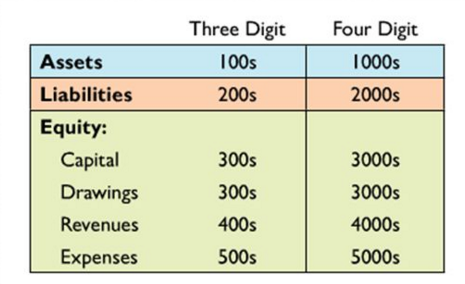
Too many accounts can be hard to manage. The Chart of Accounts is a numbering system to organize each account. Assets, liabilities, and equity will all have their own set of numbers to identify each account.
This is an example:
Too many accounts can be hard to manage. The Chart of Accounts is a numbering system to organize each account. Assets, liabilities, and equity will all have their own set of numbers to identify each account.
This is an example:
The Canadian dollar is low and prices are rising everywhere! Expenses increase and revenues might decrease. How will you be able to keep track of how much you are spending? The expanded ledger will show where the money went and by how much. It separates the equity section into Capital, drawings, revenues, and expenses.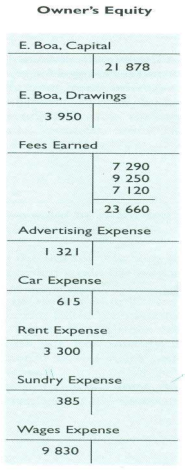
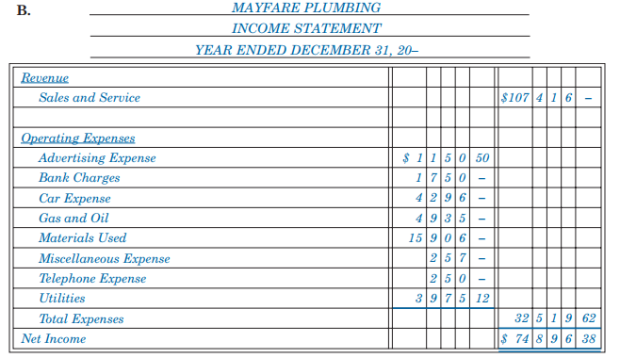
From the expanded ledger, an income statement can be made to show whether there is a net income or net loss. Net income/loss can be calculated by REVENUE-EXPENSE. To see how much much money the business will have after expenses and drawings, it can be calculated by BEGINNING CAPITAL + NET INCOME – DRAWINGS = ENDING BALANCE.
This is an example of an income statement
Chinese New Year and Valentines day is coming up! Everyone is probably in need of money but not everyone will have a couple hundred dollars in cash to pay for everything. So that is why we can pay on credit! Another thing is that money owed to us can be paid later.
Purchased on account means an item is purchased but not yet paid for.
Sold on account is when an item is sold but not yet paid for.
Paid on account is when money is paid out to a creditor to decrease the amount owed.
Received on account is when you receive money from a debtor.
